


Beyond the scores, big surprises hide in NAEP 2024 results
A former U.S. Department of Education staffer's take


I won’t spend much time summarizing the basic 2024 results we all (i.e. anyone in K-12 education) predicted for just a few years after the pandemic: they were generally still bad, but showed some small (and promising) improvement for younger learners.
You can read the initial shock headlines anywhere from the NYTimes, to 74Million, to Maine Morning Start, to Texas Tribune, or some more balanced (later) coverage in the NYTimes and EdWeek, and then likely the best metaphor on how student “recovery” actually works in The Hechinger Report.
But I do have an insider’s scoop to share. A scoop of data, at least. You can determine how generally scoopy (in the journalistic sense) it is.
I used to work in NCES, the division of the U.S. Department of Education that administers “The Nation’s Report Card.” As a Data Science Fellow on loan from the University of Chicago, I collaborated with the many civil service staff, contractors, and statisticians that run our education sector’s most important progress-measuring tool. I spent many hours deep in Federal data systems, reviewed the design of the assessment for how it captures 21st century skills, and even looked through thousands of anonymized transcripts on STEM course-taking. In short, I gained a deep understanding of NAEP, and have the deteriorating eyesight to prove it.
In my view, there were some arguably big surprises in 2024 results that go far beyond the topline student scores. NAEP is an incredibly rich assessment that captures educational progress beyond questions related to fractions or reading comprehension. In my first installment of a new Substack that very few people asked for, I am excited to unpack a few tricks.
The Non-Hidden Secrets of NAEP
While I was at NCES, I learned quite quickly that NAEP provides extensive contextual information beyond the immediate assessment scores. The adjoining questionnaire data captures information on practically anything you could want to know about our K-12 system experience: the undergraduate minors of teachers by state; the availability of math coaches to support 8th grade instructional planning; the degree to which teachers within a school collaborate well or not; the ratio difference between personal laptop per student vs. iPad/tablet per student; and my favorite, student self-reported procrastination and assignment completion (“I finish whatever I begin”).
And too few check them when the scores come out.
The conversation on scores is important, but I find they over-index on high-level outcomes between states or on general subjects like math and reading. That level of granularity is less helpful to education leaders in the driver's seat of a district or state agency who need to make finer-grained decisions under significant budget and time pressure, especially these days.
So here is what I am paying attention to in the new release:
Motivation and Enjoyment Are Declining
We already knew students weren’t doing well during the pandemic, between social disconnection and the far too-frequent family tragedy. However, while there are many promising signs for student mental health recovery, this optimism is not translating to their academic studies. NAEP gives us a particularly rich measurement of student dispositions – what they like, what they hope to accomplish, and how much they care about different aspects of school. Across many measures, they continue to flat-line.
Two things are abundantly clear in the NAEP data at the same time: 1) in general, achievement and student dispositions (motivation, persistence, relevance) have a strong relationship, and are closely correlated together. If NAEP scores are showing recovery, student dispositions also seem to recover at the same time 2) there are some exceptions, where motivation or enjoyment are continuing to flat-line or decline further than the scores alone, where we need to pay even closer attention.
(As an important aside: self-report surveys must always be approached cautiously because, as humans, we like to make ourselves look good. But looking over time can mitigate many of these potential response issues.) This first general relationship makes sense in both directions; if a student is doing well, they are likely to feel good and confident about school generally, and especially the particular school subject they are excelling in (NAEP even includes questions asking students how “looking smart” in front of others makes them feel). Concurrently, if a student is highly motivated, they likely will persist through harder or more challenging concepts, and do better as a result. This relationship is very annoying, however, because the two-way street makes identifying new causal impacts very hard to pinpoint.
In the 2024 results, NAEP’s combined disposition indexes (many questions on a particular disposition, like “Persistence”) and individual disposition questions (“I want to understand as much as I can in math class”) all show significant declines from the pandemic, but also signal some more recent recovery – just like the scores themselves.
Yet interestingly, at least a few of these measures, including several new questions that were introduced in 2017, began declining in 2019 even before the pandemic.
Grade 8: “I want to become better in math this year” [M831505]

Grade 8: “I want to become a better reader this year” [R849705]
And then there are the ongoing exceptions: the dispositions that either flat-lined or even seem to be potentially declining further. For one example: young people seem to be enjoying their school subjects even less than in 2022. And unfortunately, our core school subjects more often than not have a low starting-bar for 4th and 8th grade students.
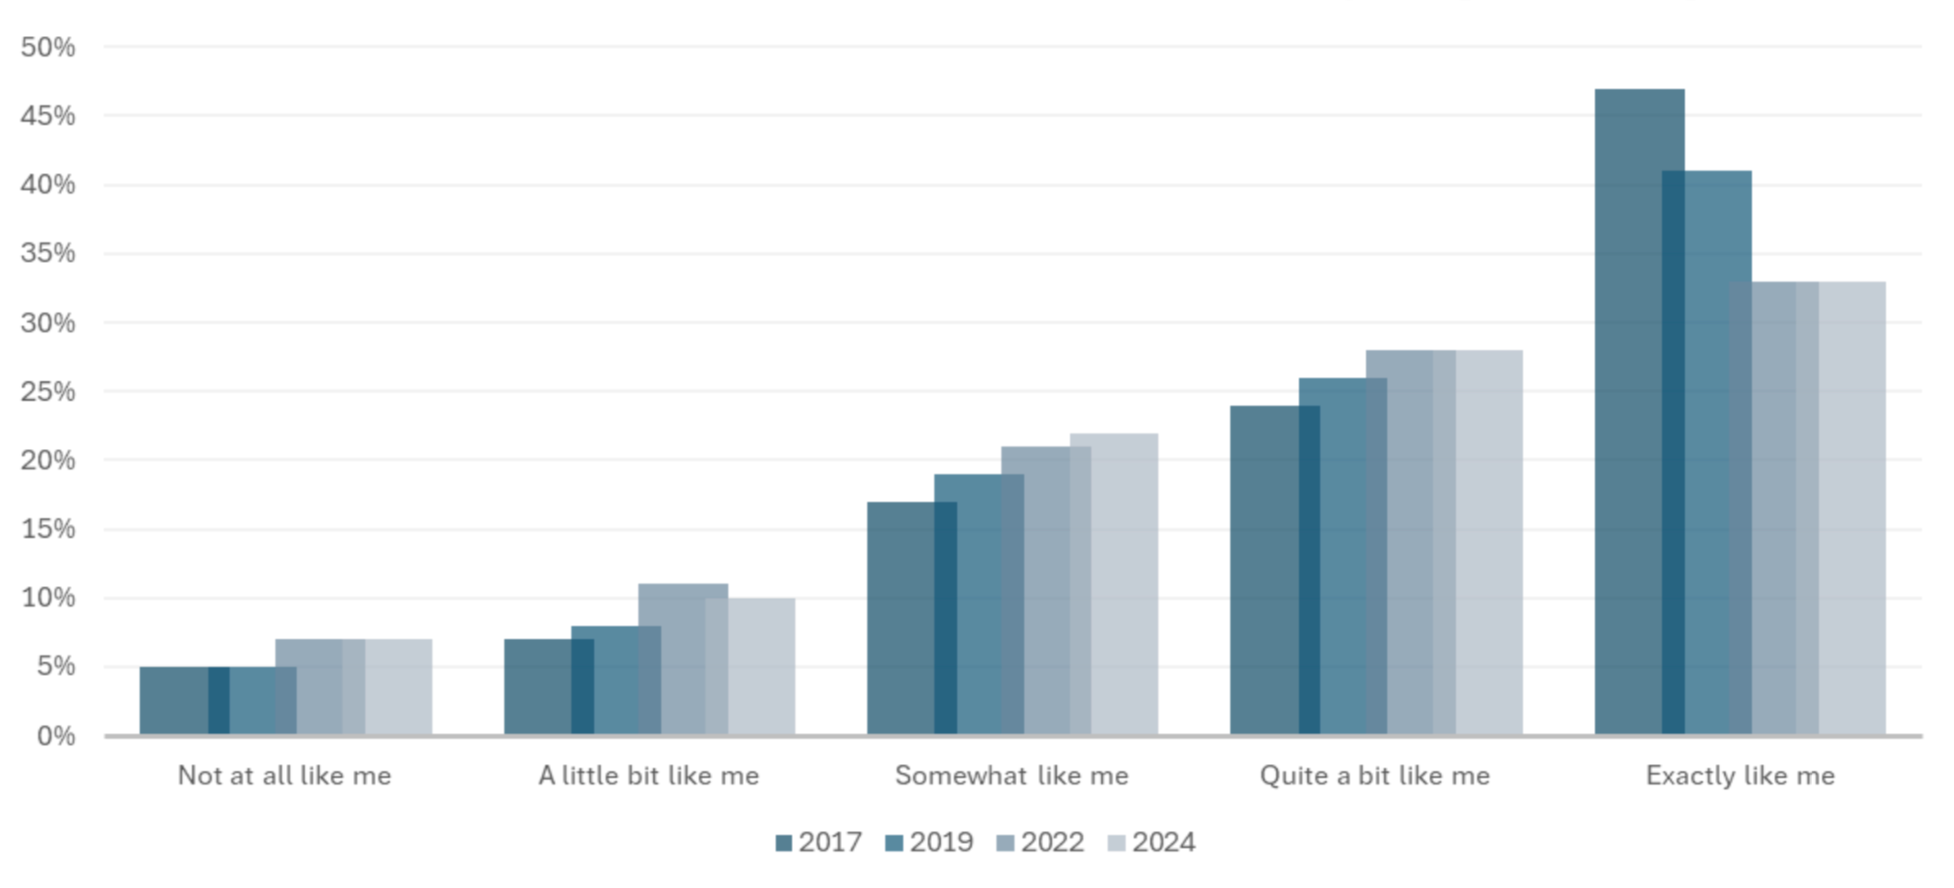
For one example, readers of this Substack might be shocked (shocked, I tell you!) to learn that the overwhelming majority of today’s middle school students don’t find math very interesting (64% marked “somewhat” or less), nor particularly enjoy doing it (only 14% report enjoy doing math “exactly” describes them).
Grade 8: “I enjoy doing math” [M831901]

Grade 8: “Reading is one of my favorite activities” [R849801]

There’s a Growing Relevancy Crisis
One result stuck out to me in particular: among the majority of all NAEP disposition questions, the most significant drop is in how students view their school subjects as useful or not. It turns out that across subjects and grade-levels, students view their learning to be increasingly useless. Scores related to the “utility” of Mathematics or English both continued to flat-line or even further decline into 2024 for students.
This effect was the most extreme for one student disposition question in particular, which should alarm a great number of people: “Math will help me even when not in school.”
Over half of our middle school students don’t believe math is much more than “somewhat” helpful beyond school. And ratings for this belief, and even the more simple belief of “it is important to do well in math,” continued to decline in 2024.
This trend should be surprising in the age of AI and big data. So much of our recent technology is all riding on math, automated with computers, applied to data.
Yet teachers will not be surprised whatsoever by this section. The age-old question of “why do I have to learn this?” or “What is this useful for?” is a recurring one, especially in middle or high school math. Every time I present at a conference, I hear this. We don’t do a good enough job of connecting mathematics to where the excitement is for student, or what students are hearing about on a daily basis – ChatGPT, Artificial Intelligence, the weekly sports scores, or even the grocery prices. Math in K-12 is too often separated from students’ personal interests, other school subjects, or their future careers.
As a fun aside, I was too amused by this sponsored think-piece on AI and math by medical company Medtronic not to include it somewhere. The further I dug into this question, the more I was shocked.
You may be wondering, like I did, whether this matters “for the smart kids,” for lack of a better phrase. Given the growing achievement gap between high-performers and low-performers we saw in 2024, one would assume that the utility of math beyond school doesn’t matter much for the high-flying students, who may already be dreaming of their favorite college in middle school (like I, a small nerd, was). And you’d be very wrong.
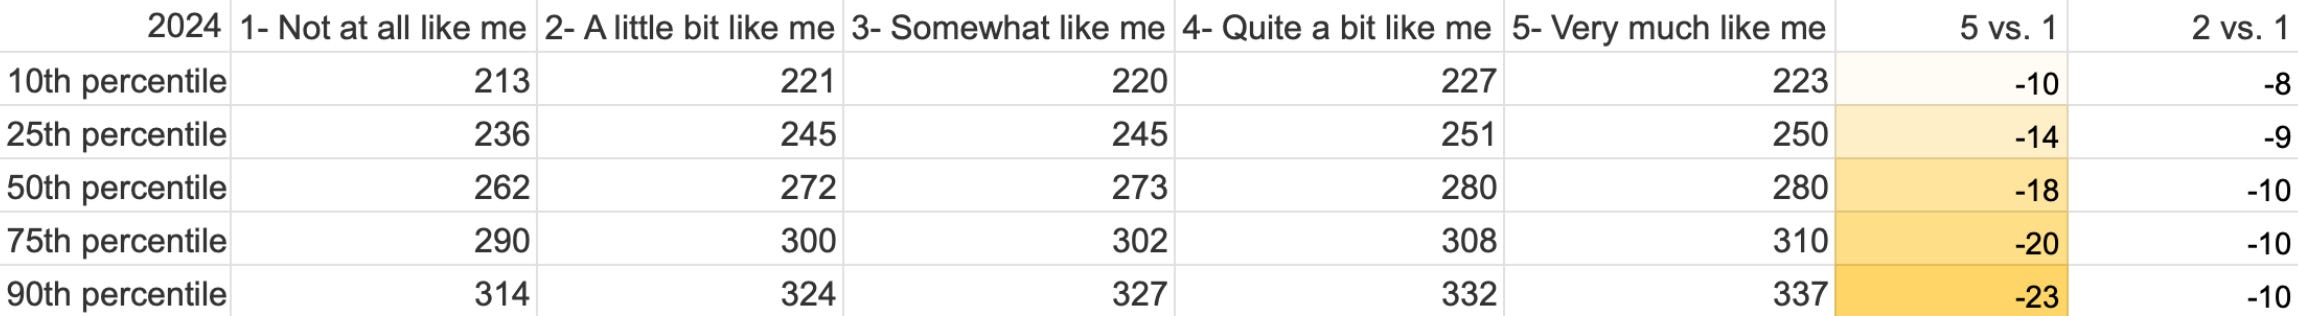
Within the top performing 10% of students, the difference between thinking that math will help beyond school “a little bit” versus “not at all” correlates with a drop of ~10 points in NAEP achievement, and that result has been consistent in every year the question has been asked. For context, NAEP analysts count 10 points as roughly equivalent to a full year’s worth of academic growth. This effect continues across most student performance groups, depending on the year.
Grade 8, > 75th Percentile Performers: “Math will help me when not in school” [M831905]

The effect works in the other direction too. Students in the top 10% who believe that their mathematics class is “very much” useful outside of school then score between 10-to-13 points higher than their peers in this same group. In short, it turns out that the perceived relevance of your math course seems to have a strong relationship to test scores.
The same is generally true for the bottom-performing 25% of students, with an important twist. Moving the utility of math from nothing to just “a little bit” also earns a 10-point boost for students, even at the very lowest NAEP score, which we should be very encouraged by. However, this effect becomes a bit mixed (and even non-linear) as a student’s rating moves up the scale. So in short, we don’t need to prove math should be everyone’s most favorite oyster in the world – moving from nothing to “a little bit” might be enough to generate the most impact. And we need more research on this front.
Grade 8, < 25th Percentile Performers: “Math will help me when not in school” [M831905]

(As another important aside, NAEP only gives us correlations; as the regular readers of this brand new Substack know, that does not mean causation! But, we can at least detect effects worth looking into more deeply)Most importantly – the actual work required of an educator or by reworking the curriculum to emphasize relevance may be much more substantial, as again, these are just simple correlations. And detecting whether success increases perceived utility is also hard to decipher. But this relationship is remarkably consistent over time, even amidst the significant disruption of a global pandemic.
Algebra is Up, Statistics is Down (again).
Last one, but this is an important one for me. NAEP shares a breakdown of content areas within school subject areas. These results are easy to miss if you’re only following coverage in major news outlets.
For mathematics, there has been a very clear, decade-long trend that I warned about previously in the 2022 release: basic understanding of Data Analysis, Statistics, & Probability (DASP) has fallen precipitously compared to other topics within math.
Want one example?
In the 2023-2024 school year, the number of American 8th graders who could estimate a number from a simple bar graph was only 29%.
But it’s not that middle schoolers’ basic understanding of data analysis or even simple chart literacy is declining — it’s fallen to dead last.
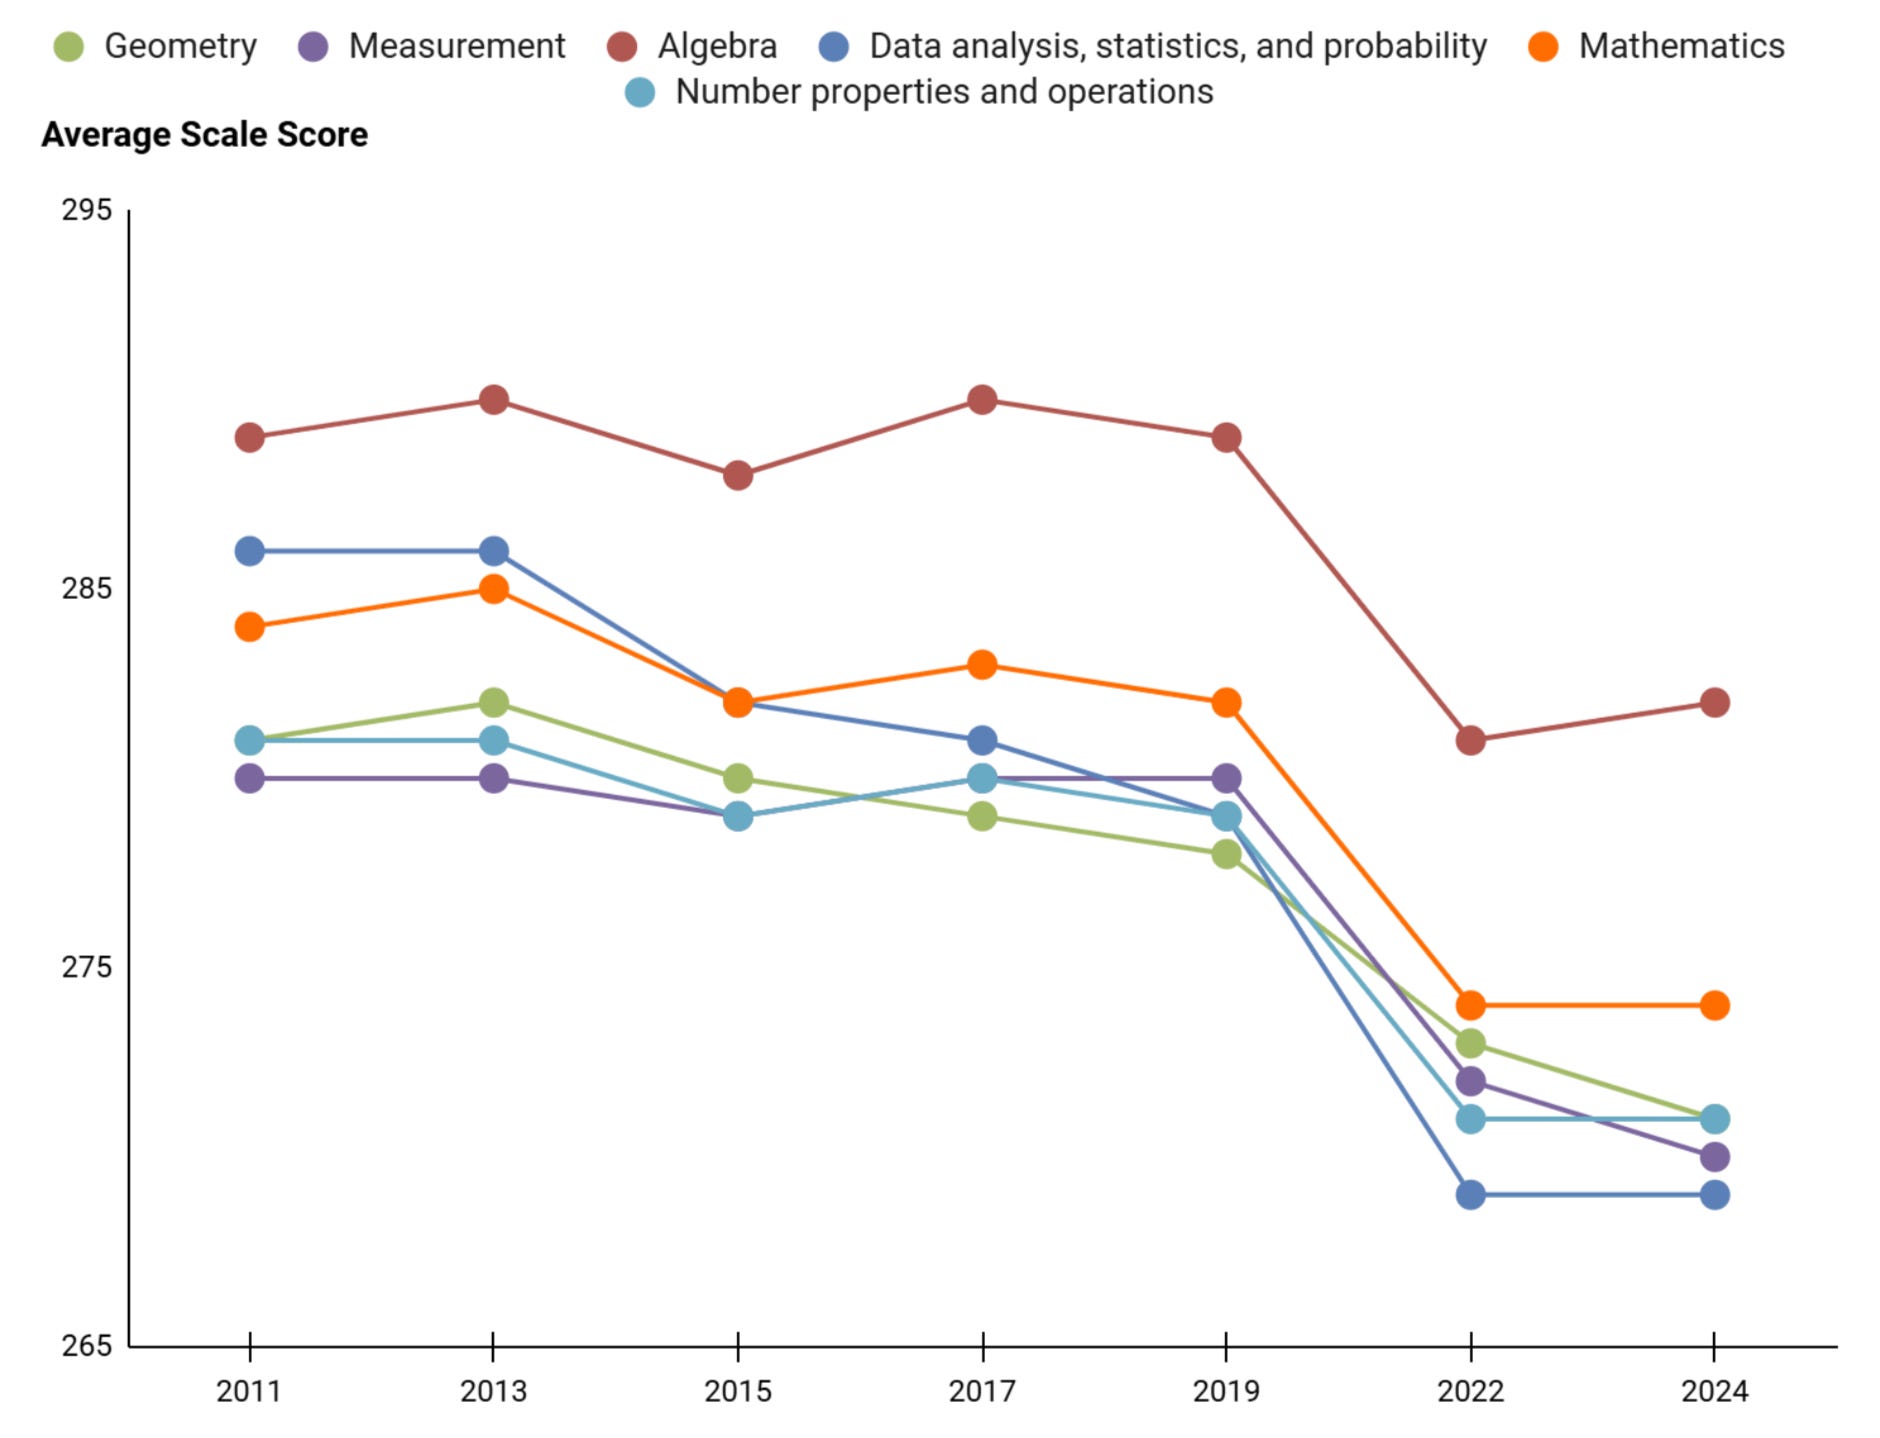
Moreover, its close cousin, the Measurement content area, which covers things like unit conversion, is sliding to join DASP as an unlucky bedfellow. Meanwhile, Algebra has shown small signs of improvement, and continues to maintain a significant lead over the other content areas. A good thing that we need to build on.
NAEP math grade 8 performance, 2011-2024, by content area
These content areas should not need to compete like some kind of horse-race. Rather, the field needs to quickly identify causes, both for the areas that are going well and those going less so. And we need an all hands-on-deck focus on data education in particular; given AI, given misinformation, given social media, and given all the other complexities our students regularly navigate online.
The news is thankfully more encouraging in 4th grade, with an early recovery potentially underway, especially for the critical area of Number Properties and Operations at this age.
Yet within the content areas, there are exceptions once again. Can you guess them?
Hint: Find the two areas that have fallen the most since 2011.
NAEP math grade 4 performance, 2011-2024, by content area

In U.S. math education, Geometry and Data often get the short straw. Whether this is a result of instructional prioritization decisions that were made during the pandemic to ensure students reach the next grade level with less time, the tendency for geometry and data to be cut for time at the end of the year, a lack of teacher confidence in these areas, or something else, we need to boost investment and interventions in these areas.
My argument here is not that we should abandon our focus on critical mathematics foundations in number properties or operations. Young students need to be learning addition and multiplication, period. Middle schoolers could all benefit from a strong preparation in Algebra. But given the world is changing beyond the classroom, we need to figure out why these other content areas in mathematics are not only keeping pace, but are in fact moving in the exact opposite direction than we would want in the 2020s.
Wrap-Up
NAEP is a behemoth of an instrument (once described by a staff-member to me as “the titanic of assessments”). It’s a complicated tool that creates a very rigorous picture of U.S. student achievement through a carefully balanced sample of students in schools and districts across the country. Inside the team that produces it, there are many motivated, if not euphoric, staff discussions about “trend reliability” or “sample balance.” Things you might not care much or even think about regularly, but are critical for education leaders to get their bearings on how we’re doing. Without it, our system would have no lighthouse, nor highly-credentialed (and mildly geeky) lighthouse keepers.
I hope this helps folks recognize its power, statistical and otherwise.
Want to see it all for yourself? Find the raw data here.
Fascinating read. Student self efficacy needs to be explored in today’s context.